News
The Role of the Australian Workplace Return to Work Coordinator: Essential Qualities and Attributes Jun 18th, 2014
In the Australian context, a return to work (RTW) Coordinator (or Injury Management Co-ordinator) assists an injured worker with workplace-based support and regulatory guidance for the duration of their injury. Coordinating the RTW process has been considered an effective approach for managing workplace injuries. This study aimed to provide insight as to the skills and attributes needed for the role of the workplace RTW Coordinator from their experience and perception.
Conclusion: Effective management by the RTW Coordinator of the complex RTW process is essential to facilitate a smooth transition for the injured worker, alongside maintaining a professional relationship with the employer and external stakeholders. The results of this study can be utilised to further improve the selection of future RTW Coordinators.
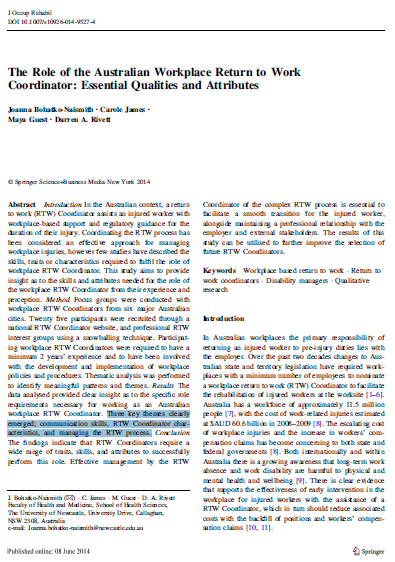
Three key themes clearly emerged: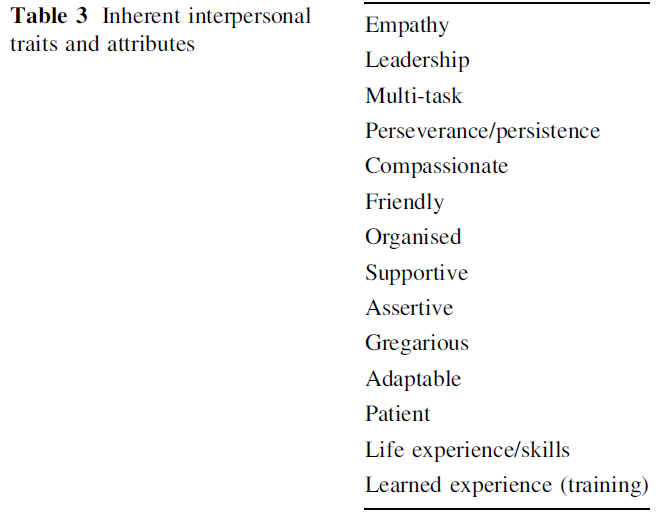
- Communication skills
- RTW Coordinator characteristics
- Managing the RTW process
Sedentary behavior increases the risk of certain cancers Jun 17th, 2014
Physical inactivity has been linked with diabetes, obesity, and cardiovascular disease, but it can also increase the risk of certain cancers, according to a study published June 16 in the JNCI: Journal of the National Cancer Institute. To assess the relationship between TV viewing time, recreational sitting time, occupational sitting time, and total sitting time with the risk of various cancers, Schmid and Leitzmann of the Department of Epidemiology and Preventive Medicine, University of Regensburg, Germany, conducted a meta-analysis of 43 observational studies, including over 4 million individuals and 68,936 cancer cases.
When the highest levels of sedentary behavior were compared to the lowest, the researchers found a statistically significantly higher risk for three types of cancer—colon, endometrial, and lung. Moreover, the risk increased with each 2-hour increase in sitting time, 8% for colon cancer, 10% for endometrial cancer, and 6% for lung cancer, although the last was borderline statistically significant. The effect also seemed to be independent of physical activity, suggesting that large amounts of time spent sitting can still be detrimental to those who are otherwise physically active. TV viewing time showed the strongest relationship with colon and endometrial cancer, possibly, the authors write, because TV watching is often associated with drinking sweetened beverages, and eating junk foods.
The researchers write “That sedentariness has a detrimental impact on cancer even among physically active persons implies that limiting the time spent sedentary may play an important role in preventing cancer….”
In the studies analysed, the least amount of time people spent sitting down was about two or three hours. Each two hours per day increase in sitting time above this level was said to increase the risk of bowel, endometrial and lung cancer.
Postures assumed when using laptop computers and desktop computers Jun 17th, 2014
This study evaluated the postural implications of using a laptop computer. Laptop computer screens and keyboards are joined, and are therefore unable to be adjusted separately in terms of screen height and distance, and keyboard height and distance. The posture required for their use is likely to be constrained, as little adjustment can be made for the anthropometric differences of users. In addition to the postural constraints, the study looked at discomfort levels and performance when using laptops as compared with desktops.
The results showed significantly greater neck flexion and head tilt with laptop use. The other body angles measured (trunk, shoulder, elbow, wrist, and scapula and neck protraction/retraction) showed no statistical differences. The average discomfort experienced after using the laptop for 20min, although appearing greater than the discomfort experienced after using the desktop, was not significantly greater. When using the laptop, subjects tended to perform better than when using the desktop, though not significantly so. Possible reasons for the results are discussed and implications of the fundings outlined.
Mental Toughness Jun 12th, 2014

'Mental toughness' is a term that is often thrown around as central to high sports performance.
Defined as a personal capacity to produce consistently high levels of subjective (e.g., personal goal achievement) or objective (e.g., race times) performance despite everyday challenges and stressors as well as significant adversities.
Mental toughness is often discussed as a collection of personal characteristics including attributes such as self-confidence, optimistic thinking, buoyancy, self-determination and self-efficacy. Self Efficacy theory suggests the degree to which individuals perceive their actions as efficacious will determine how much effort they expend and for how long they persist on tasks.
Mental Toughness has been shown to be related to performance, and related to a social environment that nurtures autonomy, competence, and relatedness (termed autonomy-supportive). Autonomy-supportive environments are characterized by the offering of choice (within boundaries), the acknowledgment of feelings or perspectives, the use of noncontrolling actions and feedback, the provision of meaningful rationales, and the nurturing of individuals’ inner motivational resources (e.g., curiosity, enjoyment, belonging). In comparison, controlling environments are characterized by the manipulative use of rewards, negative conditional regard, intimidation, and excessive personal control.
It is suggesed that the provision of autonomy-supportive environments lead to the facilitation of mental toughness, whereas controlling environments may lead to the forestallment of mental toughness. Mental toughness development is contingent on an athlete being afforded opportunities to explore and engage in tasks volitionally (e.g., self-directed learning), perceiving themselves as competent and feeling challenged during learning (e.g., being able to demonstrate skill mastery, engage in competitive challenges), and feeling respected, cared for, and needed by those around them (e.g., positive social support, a sense of belonging).
Understanding Training Load Jun 12th, 2014
I get asked about training load quite a lot. Coaches will generally ask about how to periodise an athletes training load, athletes will ask about how can they adjust their training so that they can get better recovery or optimise this training load so they can peak for competition and parents want to know how they can ensure that their kids are going to be overtrained.
The first point to make is that training load is a very important variable to have under close control. It is possible to manipulate training variables within a week to maximise an athletes readiness to train. This has a double effect in that it decreases the risk of overtraining, leading to injury and illness, as well as increasing the likelihood that an athlete will gain a high level performance outcome.
I was at a conference in 2008 and heard a presentation from a prominent Performance Coach who was working with a Super Rugby team at the time. He used an analogy to describe training load that I quite like. He spoke about each athlete having a cup and every time we train or compete we are filling that cup with a volume of fluid congruent with the intensity of that that session or game. Every time that athlete performed an action to help their recovery, such as having a day off, getting a massage or doing a pool session, they empty their cup of a volume of fluid congruent with the benefit gained from the recovery modality. The end goal was to have the cup as full as possible without overflowing and when the cup did overflow, the athlete was at greater risk of illness and injury. I’m sure that there are people out there who could poke holes in this analogy but I like the imagery that it provokes.
This analogy points out the importance of managing training load and that it is about balance and in order to do that we need to have a tool for measuring an athlete’s training load. Training load is commonly assessed using a subjective assessment tool such as the RPE scale. The RPE scale is comes in various forms and correlates a number to a descriptor of an athlete’s level of exertion. In order to assess an athlete’s training load, we need to ask them to rate the difficulty of the training session within the first 30 minutes of them finishing the training session. We ask them to rate how difficult the session was physically and mentally and ask them to take into consideration how they felt prior to starting the session. This will alter the score based on their residual levels of fatigue. We then multiply this score by the duration of the session, which give us an arbitrary unit, which is our training load. We then total the score and record these values over a period of weeks.
There has been a lot of research about training load and while there are individual variations it has been found that when using the Borg 1-10 RPE scale, when athletes have a week of training where they are above 3500 points, they are at increased risk of having an adverse outcome such as injury or illness. Consecutive weeks of training load values greater than 3500 points can further increase the risk of injury and illness related to over training.
In my career I have found monitoring training load to be a very useful tool from a number of aspects, namely:
- Maximising performance outcomes through ensuring effective difficulty of training contrasted with adequate recovery
- Decreasing the risk of injury and illness through flagging consecutively high weekly training loads
- Monitoring the training load of players as they return from injury to ensure adequate return to full fitness, while minimising the risk of re-injury
I have also found that there is no single structure that can be applied to any athlete. It is definitely more of an art rather than a science with regard to determining what an individuals training load tolerances are during various sections of the season. I have had some athletes who have been able to tolerate weekly training loads greater than 4000 points during pre-season, while other athletes can only manage less than 2000 points per week before they start to breakdown.
It is important to plan your season according to the requirements of the athletes from a training load point of view. During pre-season phase we need to have periods of increasing intensity contrasted with periods of rest and recovery in order to training hard to gain a physiological effect and then allow the body to recover. During the in-season phase we need to allow athletes a chance to peak for their games and competitions which are generally more taxing on their bodies than training sessions.
I want to present 3 case studies of athletes at various levels throughout their season. I hope that these give a good example of how different each athletes training load can be and how there isn’t necessarily a correct answer, other than doing what is right for the athlete.
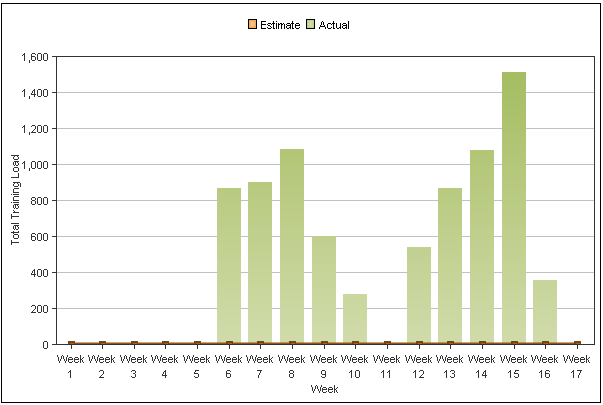
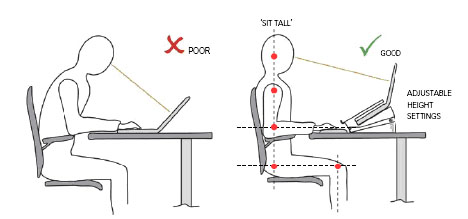
The first case is of a junior elite athlete who plays cricket and is currently in her off-season phase. The emphasis of her training is essentially based in the gym and working on improving her bilateral strength as she has development significant asymmetry in both her upper and lower body throughout the last cricket season. As you can see from graph of the athletes weekly training load scores, she is barely reaching the limits of what she would be allowed normally during the pre-season phase.
We would normally give an athlete like this up an allowance of up to 3500 points per week and she has barely reached an average of 1000 across the 10 week off-season phase. In week 18 of the above graph she will switch into a pre-season phase where she will have a much more structured training load graph which will be more phasic to allow for adaptation and progressive overload as she becomes strong and fitter.
The second case is a basketballer who lives in regional Western Australia. She is involved in an elite development squad which trains fortnightly in Perth. There are 2 other girls who also live rurally and fortnightly they all travel between 5-6 hours to attend weekend camps for the squad. The weekend camps are very hard and they generally consist of two days with a cumulative training and game time of approximately 10 hours. The graph below demonstrates this fortnightly variation and ‘spike’of intensity followed by a lower volume week.
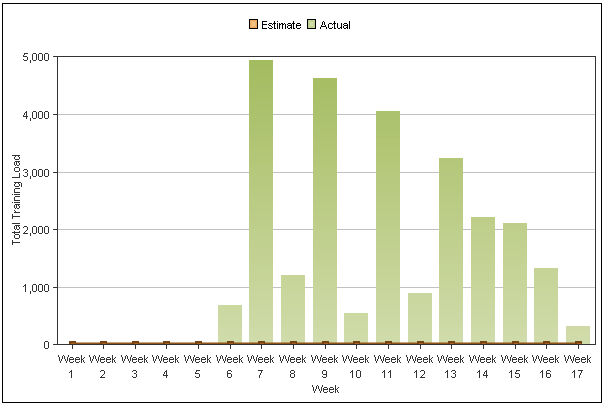
The above graph demonstrates an interesting pattern which shows a combination of two very key criteria. Firstly, the athlete was able to tolerate the heavy weeks better as her conditioning improved. Secondly, this graph shows the benefit of regular education to improve physical performance. As the athlete improves their ability to tolerate training load of high intensity also improves therefore, what would have been a very similar weekend camp results in a lower total training load. The second part of this equation is athlete education and improving training scheduling. I spent a lot of time educating the athlete on the importance of reducing her training load during the ‘off-weeks’. There are a number of ways that this can be done:
- Reduce training time - instead of training for 90 minutes train for 60 minutes
- Reduce training intensity - instead of doing a shooting session with repeat sprints in the session, do a shooting session with a slow jog between shots
- Swap training sessions to recovery sessions - don’t get on the court, instead go to the pool and do a recovery session, get on a bike and do an off-loaded conditioning session or get a massage
The final training load graph that I would like to address is a field hockey athlete who is in the in-season phase. This athlete is currently doing 3-4 skills/conditioning sessions per week in addition to 2-3 weights sessions on top of games as weekends. This athlete can be best described as a very intense athlete who trains very hard during every session, irrespective of how their body and mind is feeling. The issue with athletes such as these is keeping their training load under control as they often struggle with holding back and run the risk of over training.
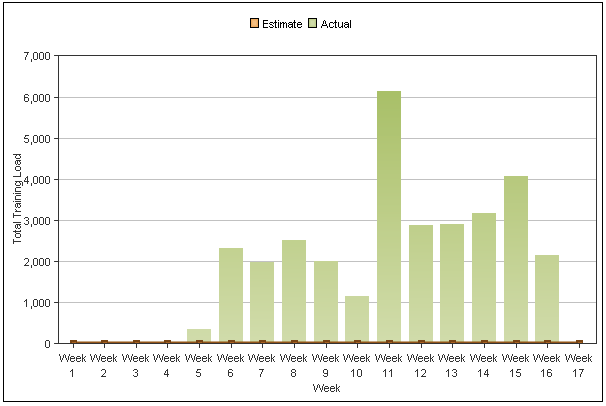
During week 13 the athlete developed a viral cold from which it took 3 weeks to fully recover. Note that prior to this period of time she had one week at 6000 points followed by one week at 3000 points, then three consecutive weeks over 3000 points. Ideally the athlete would have been given an easy week in week 12 (less than 1000 points), a moderate week in week 13 (2000 points) and then allowed to go back to normal in week 14. I would speculate that her illness would have been easier to manage had this process been undertaken. The difficulty with monitoring this athlete is that she is an amateur athlete who manages a lot of her own training sessions away from the gym. This is the first time that she is in our academy program as well and we are only just starting our education process with our athletes. In a professional team setting for example, we would have grabbed a hold of her at the start of week 12 and 100% controlled every aspect of her training from a duration and intensity point of view to allow her to still compete but at the same time ensure that she didn’t over train during consecutive weeks. A good lesson for us all!
So that is my little blog on training load, hopefully you have been able to gain some insight from the examples that I have given. My parting thoughts are my three mantras that you should always consider when attempting to manage training load:
- Manage each athlete as an individual
- Think about the athlete as a person - think physical and mental wellbeing
- Get the data on to paper in whichever format you deem necessary - if you don’t have data you have nothing!!
I hope you enjoyed this little read - all the best with your monitoring and I’ll chat with you next time.
Adrian Cois
Performance Coach
BAppSci (Exercise Science)
adrianlcois@gmail.com
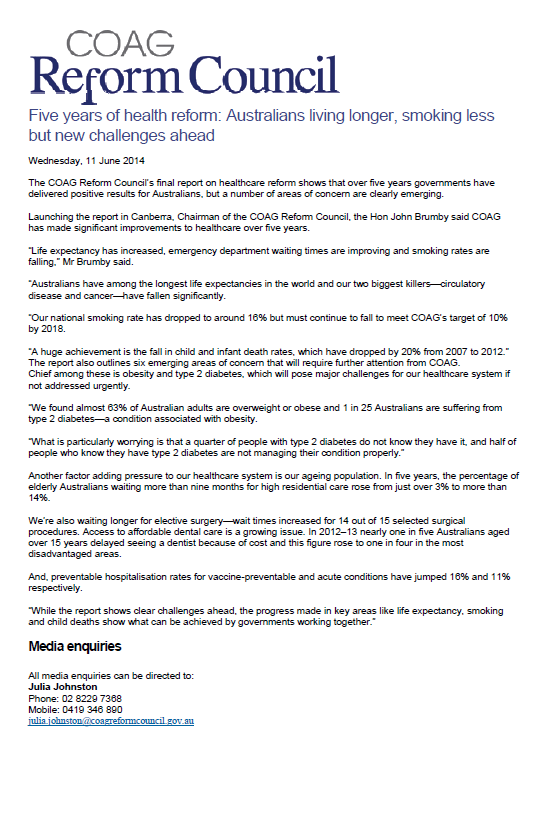
Media Release - Five Years of Health Reform COAG Jun 12th, 2014
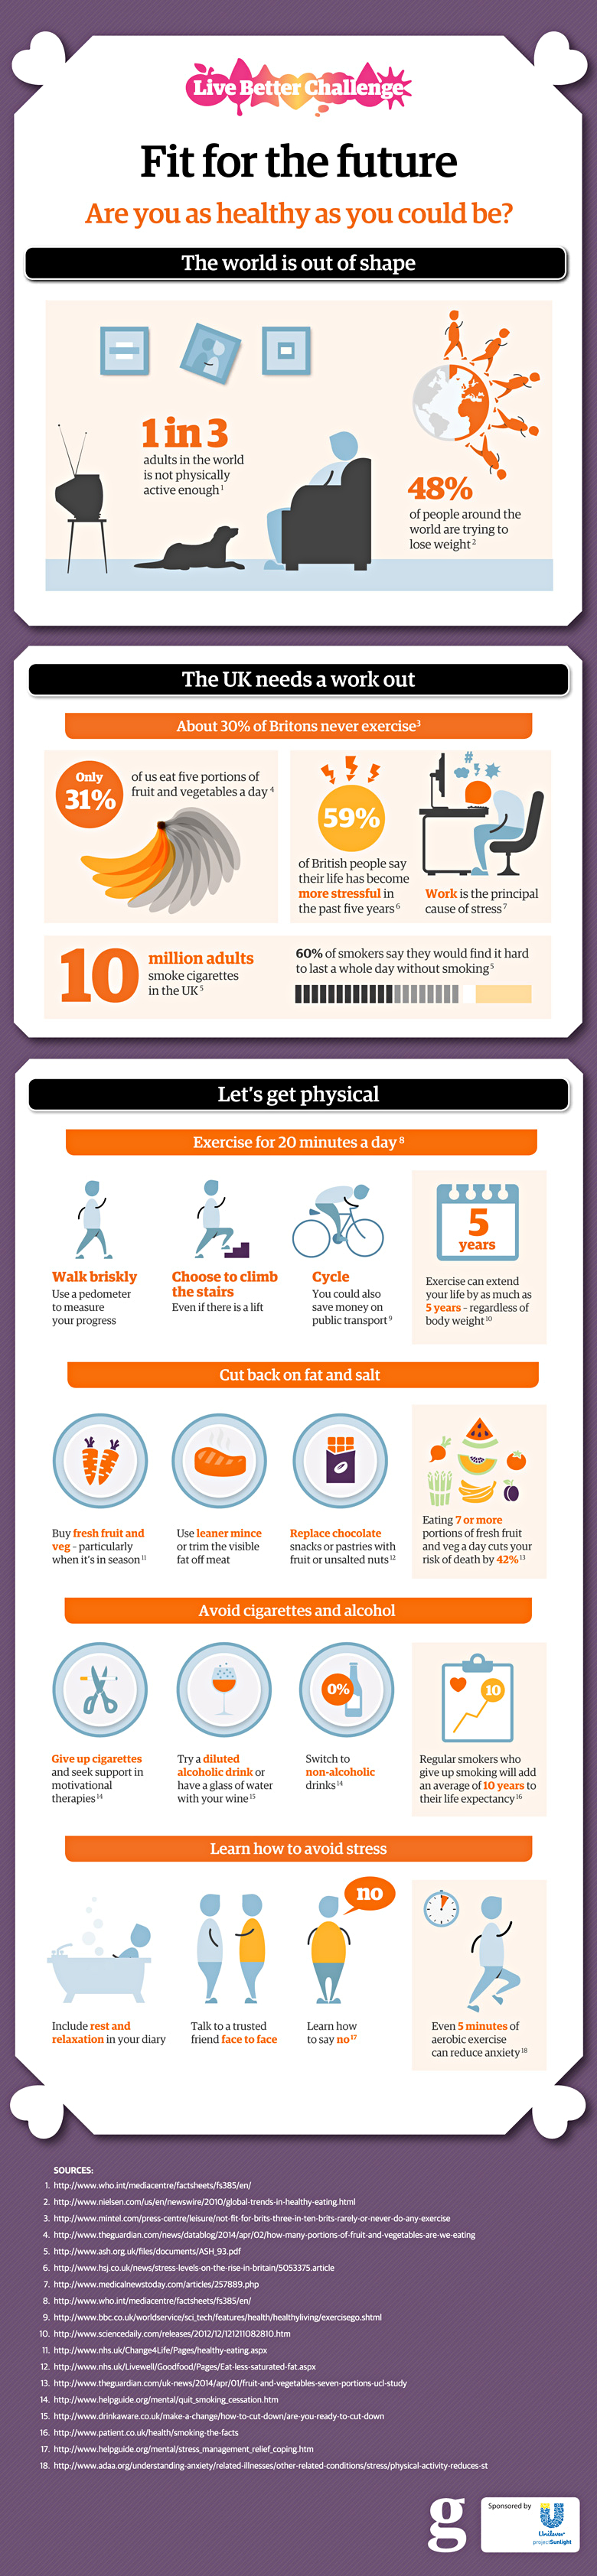
Infographic - Exercise Jun 11th, 2014
Heads Up - Preventing psychological injury Jun 4th, 2014
Creating a mentally healthy workplace is everyone's responsibility! The
Heads Up campaign was launched last month to business leaders to take action on mental health. As part of Heads Up, an Action Plan will be unveiled later this month.
Safe Work Australia and work health and safety regulators have resources which can assist organisations manage
mental health in their workplace. For example, Safe Work Australia recent
ly published a number of fact sheets:Preventing Psychological Injury Under Work Health and Safety Laws, to assist persons conducting a business or undertaking and workers address psychological health risks to ensure the health, safety and welfare of all persons at work
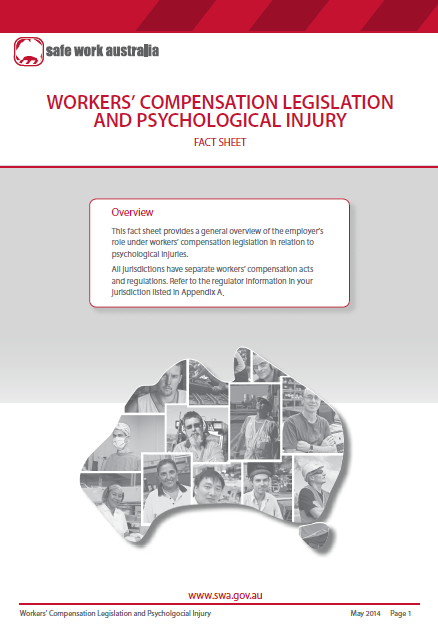
Workers' Compensation Legislation and Psychological Injury, which provides a general overview of the employer’s role under workers’ compensation legislation in relation to psychological injuries.
Healthy Aging at Work Jun 4th, 2014

Australia’s population will both grow strongly and become older in the medium term. This population growth and ageing will affect labour supply, economic output, infrastructure requirements and governments’ budgets, and has lead to the suggested increase in the retirement age from 65-70 for those people born after 1965. Such changes are likely to have down stream impacts on employers due to a gradual increase in the average age of your workforce.
Safety and Health Outcomes Associated with Aging and Work
Aging affects a variety of health conditions and outcomes, including both chronic health conditions and likelihood of on-the-job injury. However, the exact nature of these relationships has only recently been better understood, and it is quickly becoming clear that appropriate programs and
support in the workplace, community, or at home can help workers live longer, more productive lives.
Chronic Disease and Aging
Arthritis and hypertension are the two most common health conditions affecting older workers, impacting 47% and 44%, respectively, of workers over the age of 55. An even greater proportion of workers (more than 75%) are estimated to have at least one
chronic health condition that requires management. Diabetes is perhaps the most costly of these; one study found that 1/3 of all Medicare spending goes towards management of diabetes.
The frequency of these conditions and others in older adults has important implications for workers can physically perform their duties, but also when. Higher morbidity means more absenteeism when an employee feels sick and more
presenteeism when an employee is ill but shows up to work regardless. However, individual health risk factors are a stronger influence on future
healthcare associated costs than advancing age alone. In comparing young
workers with “high risk” of chronic disease (5 or more risk factors) to older workers with few or no risk factors, the younger workers had significantly higher medical costs associated despite the disparity in the age groups: 19-34 year olds, versus older workers aged 65-74.
Safety and Aging
As for safety on the job, workers who are older actually tend to experience
fewer workplace injuries than their younger colleagues. This may be because of experience gathered from years in the workplace, or because of factors such as increased caution and awareness of relative physical limitations. The caution is well-founded. When accidents involving older workers do occur, the workers often require more time to heal, underscoring the need for a well-planned
return to work program. Some evidence suggests incidents affecting older workers are more likely to be fatal, underscoring the need for employers to be mindful of how best to adapt the conditions of work to protect workers as well as explore opportunities for preventative programs that can maintain or build the health of employees through their working life.
Benefits of an Age-Friendly Workforce
Employers increasingly see the value that older workers bring to the job. Older workers have greater institutional knowledge and usually more experience. They often possess more productive work habits than their younger counterparts. They report lower levels of stress on the job, and in general, they get along better with their coworkers. Finally, they tend to be more cautious on the job and more likely to follow safety rules and regulations.
Workplaces, often out of necessity, have adapted to older workers. Discrimination based on age or disability is inappropriate, and current
government policy is rewarding and supporting the retention and employment of qualified workers despite limitations that may come from age or disability. However, some employers are more proactive than others, realizing that a well-designed, employee-centered approach to the physical nature and organization of work benefits all workers regardless of their age.
Workplace design, the flexibility of the work schedule and certain
ergonomic interventions increasingly focus on the needs of older employees. Many workplace accommodations are easy to make and are inexpensive. Modern orthotics, appropriate flooring and seating, optimal lighting, and new information technology hardware and software can smooth the way to continued work for older individuals. New emphasis on job sharing, flexible work schedules, and work from home can support added years in the job market for many. Although work may not be beneficial for all older persons, for many it is an important avenue to economic security, enhanced social interaction, and improved quality of life.
Simple Strategies for an Age-Friendly Workplace Jun 4th, 2014
Many effective workplace solutions are simple, don’t have to cost very much, and can have large benefits if implemented properly with worker input and support throughout all levels of management.
Below are some strategies for preparing your workplace for a healthier, safer and more age-friendly workforce. Consider putting these strategies in place today:
- Prioritize workplace flexibility. Workers prefer jobs that offer more flexibility over those that offer more vacation days. To the extent possible, give workers a say in their schedule, work conditions, work organization, work location and work tasks.
- Match tasks to abilities. Use self-paced work, self-directed rest breaks and less repetitive tasks
- Avoid prolonged, sedentary work. Prolonged sedentary work is bad for workers at every age. Consider sit/stand workstations and walking workstations for workers who traditionally sit all day. Provide onsite physical activity opportunities or connections to low-cost community options.
- Manage hazards. Including noise, slip/trip hazards, and physical hazards - conditions that can challenge an aging workforce more.
- Provide and design ergo-friendly work environments. Workstations, tools, floor surfaces, adjustable seating, better illumination where needed, and screens and surfaces with less glare.
- Utilize teams and teamwork strategies for aging-associated problem solving. Workers closest to the problem are often best equipped to find the fix.
- Provide health promotion and lifestyle interventions including physical activity, healthy meal options, tobacco cessation assistance, risk factor reduction and screenings, coaching, and onsite medical care. Accommodate medical self-care in the workplace and time away for health visits.
- Invest in training and building worker skills and competencies at all age levels. Help older employees adapt to new technologies, often a concern for employers and older workers.
- Proactively manage reasonable accommodations and the return-to-work process after illness or injury absences.
- Require aging workforce management skills training for supervisors. Include a focus on the most effective ways to manage a multi-generational workplace.
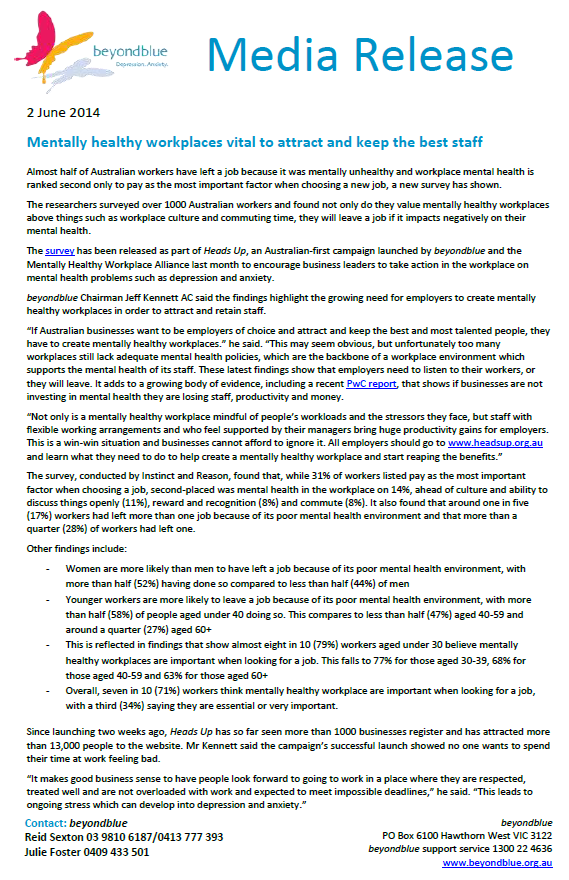
Media Release - Mentally Healthy workplaces attract better staff Jun 3rd, 2014
Interactions Between Injured Workers and Insurers in Workers’ Compensation Systems Jun 3rd, 2014
Most research on the effects of compensation has concentrated on examining outcomes rather than considering the compensation process itself. There has been little attention paid to the interactions between stakeholders and only recently has the client’s view been considered as worthy of investigation. This systematic review aimed to identify and synthesize findings from peer reviewed qualitative studies that investigated injured workers interactions with insurers in workers’ compensation systems.
Conclusion: Interactions between insurers and injured workers were interwoven in cyclical and pathogenic relationships, which influence the development of secondary injury in the form of psychosocial consequences instead of fostering recovery of injured workers. This review suggests that further research is required to investigate positive interactions and identify mechanisms to better support and prevent secondary psychosocial harm to injured workers.
Get Active for 60 Days Jun 2nd, 2014
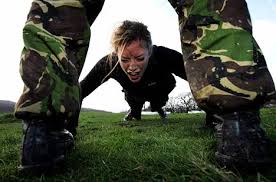
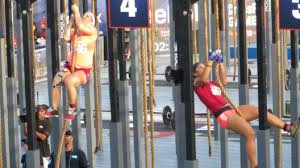
Every week it seems that we are being bombarded by all kinds of new ways to exercise that promise to strip fat and make us have strong arms, ripped abs and steel-like legs. But how do we decide what is actually going to get us the results and what is not? It seems that there has to be a right answer, something that is right there in front of us waiting to jump out at us. Is it Crossfit with its new fusion of strongman training and olympic lifting, is it hot yoga where you lose 4kgs in one session, is it boot camp where we pretend we are US Marines and get yelled at by someone with too many tattoos and a haircut that is too short. How do we know what is the answer?
The answer is simple - none of them are! The key to success is to be active in anyway possible. The benefit of programs listed above is that they motivate us, they keep us interested and they teach us a new skill, things which we humans thrive on. It is important to remember that key to achieving your exercise goals is to simply move. What does that mean exactly? Physical activity takes many forms - walking the dog, going on a nature walk, surfing, housework and yardwork. If you are one of those people who is flipping through the pages of popular culture magazines constantly looking for the newest fad, keep doing that, but also try incorporating exercise into your daily life. Take the stairs over the elevator, park the car a couple of blocks away from work and walk more in your day, ride your bike twice per week instead of driving your car and instead of watching TV with the kids for 30 minutes, go for a family walk.
We all need to stop seeing exercise as another thing that we need to add to our day and expect that some new fad is going to suddenly change us from having a low activity lifestyle to being a gym junkie - it won't happen! So here is my mantra - try it for 60 days, change something about your daily routine that means you need to walk and extra 30 minutes and get your family involved in it as well. Give it a go and hashtag your progress to #getactivefor60days.
Enjoy your new active lifestyle.
Adrian Cois.
Next Dietitian Talk
Thursday 12th June 2014
at 12.30pm.
May 28th, 2014
Temika Lee's next Dietitian Talk is on Thursday 12th June, 12.30pm at Central West Health & Rehabilitation in Geraldton. This talk is free for gym members and people who are completing Central West Health & Rehab's Diabetes Management and Chronic Disease Prevention programs.
This talk covers: 
- Healthy Eating Habits
- Glycemic Index
- Fat Types and Cholesterol
- Recipe Modification Label Reading
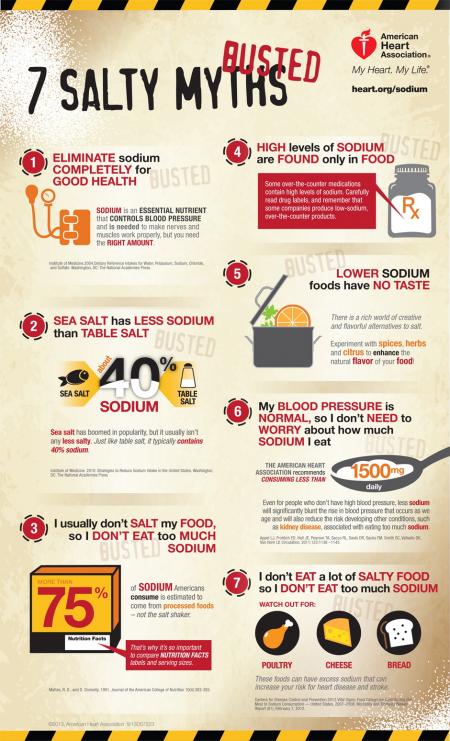
Infographic- Dietary Salt May 23rd, 2014
Science of Laziness May 23rd, 2014
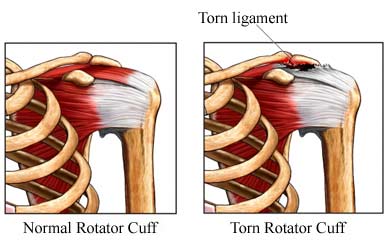
Shoulder muscle loading during over head tasks May 22nd, 2014
The task of wall painting produces considerable risk to the workers, both male and female, primarily in the development of upper extremity musculoskeletal disorders. The aim of this study was to investigate the influence of gender, work height, and paint tool design on shoulder muscle activity and exerted forces during wall painting.
Results: For both genders, the high working height imposed greater muscular demands compared to middle and low heights.
Conclusion: These findings suggest that, if possible, avoiding work at extreme heights will reduce fatigue onset and subsequently assist to prevent and mitigate potential musculoskeletal shoulder/neck injuries
Infographic- Common Hazards for the Home Handyman May 22nd, 2014
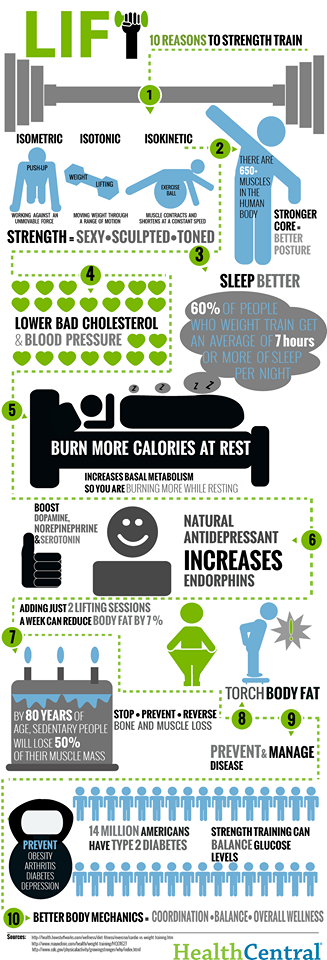
Infographic - Why Lift Weights May 20th, 2014
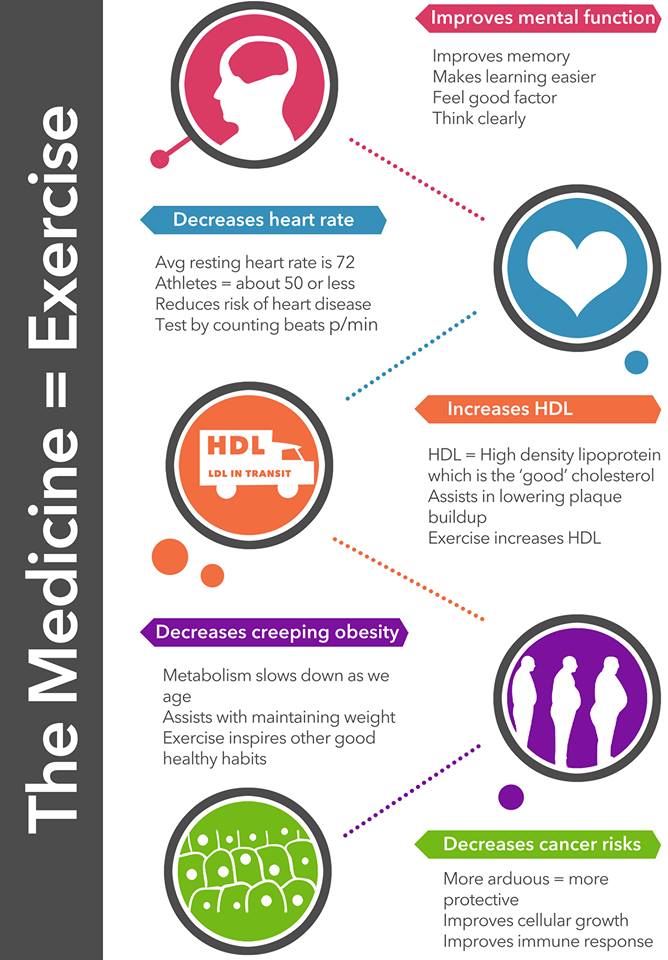
Exercise is Medicine - InfoGraphic May 16th, 2014
Poster - Sitting Take a Stand! May 9th, 2014
Poster - Stand up for Your Health May 9th, 2014
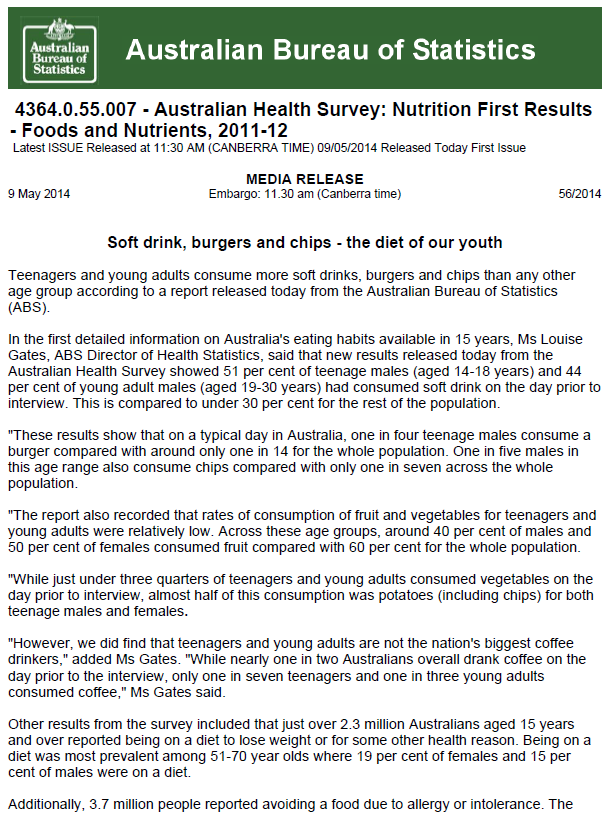
ABS - Soft Drinks, Burgers and Chips May 9th, 2014
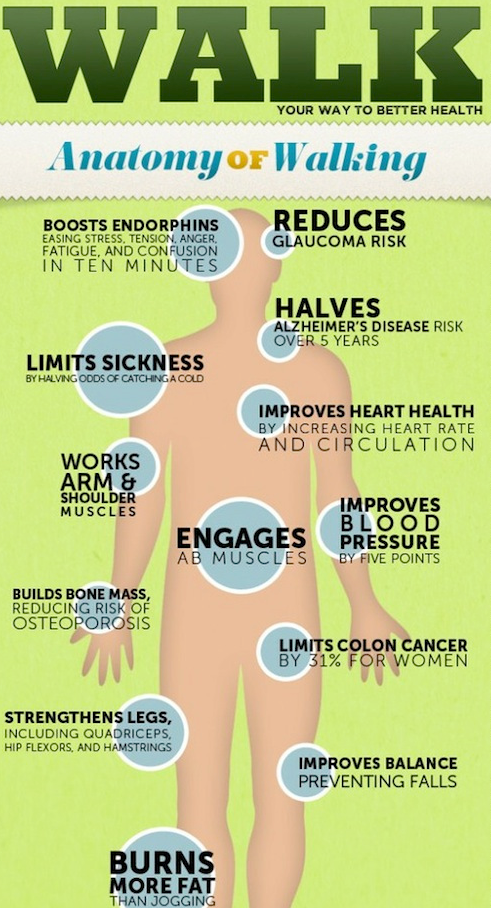
Walking Anatomy, Physiology and Benefits May 8th, 2014
Health risks we'll face if we work till 70 May 8th, 2014
With the pension set to rise to 70, it's not just those doing hard physical labour who need to consider whether they can finish their working life with their health intact.
Yes, we're living longer, as Federal Treasurer Joe Hockey loves to remind us. A child born in Australia today can expect to live to around 82, up from about 55 in 1900.
Unfortunately, these extra years are not always healthy ones.
"Not all of the benefits of increased life expectancy are equating to [improved] quality of life," says Professor Mark Harris, executive director of the Centre for Primary Health Care and Equity at the University of NSW.
And as the number of older workers grows – as predicted with a shift to a pension age of 70 – so too will the proportion of people in the workforce affected by conditions such as heart disease, cancer, diabetes, arthritis, osteoporosis, cognitive problems as well as vision and hearing loss, Harris says.

How healthy will older workers be?
The proportion of Australians who rate their health as only fair or poor generally doubles between each life stage from 7 per cent of 15-24 year-olds to 13 per cent of 25-64 year-olds to 31 per cent of people aged 65 and over.
Some diseases that are more prevalent in older people and the implications of this for older workers (or those newly retired) are:
Cancer – For many types of cancer, the risk increases with age. By 75, 1 in 3 men and 1 in 4 women will be affected. Survival rates are improving, but even for those diagnosed in mid-life, treatments may need to continue for years and can leave ongoing disabilities.
Cardiovascular disease – The proportion of people affected almost doubles from 45-54 and 55-64. This grows by a further third or so (to almost half the population) by 65-79.
Osteoarthritis – a degenerative joint condition which often affects hands, hips, knees and ankles. After age 45, the prevalence rises sharply. "It hardly ever kills you but it can really affect your quality of life," Harris says. Arthritis and other problems affecting muscles and bones are among the leading cause of employment restrictions.
Type 2 diabetes – Around 15 per cent of 45-54 year-olds have type 2 diabetes and this increases to around 28 per cent of 65-74-year-olds. Says Harrris: "Someone with diabetes who has lots of complications, they may not die but they may spend a period of time quite disabled. They may even have to have amputations."
Vision disorders: Almost double between ages 35-44 and 45-54.
Hearing disorders: Around a third of people are affected by age 55-64 and this continues to grow.
Falls – start to increase age 70-74.
Cognitive issues: "Not necessarily dementia, but people simply having vascular problems in their brains. This starts to happen in the 70s particularly; people start not to be able to function as they have been."
Reference:
http://www.abc.net.au/health/thepulse/stories/2014/05/08/4000407.htm